Plain-English reads on Massachusetts real-estate markets — what the numbers mean for buyers, sellers and investors. Figures below update with live MLS data.
October 2026
Market Insights by Keeping Current Matters
Why Most People Are Still Glad They Bought a Home
If you are on the fence about buying, you are not alone. Prices feel high, rates are higher than anyone wants, and everyday costs are up. It is easy to wonder if you would regret it.
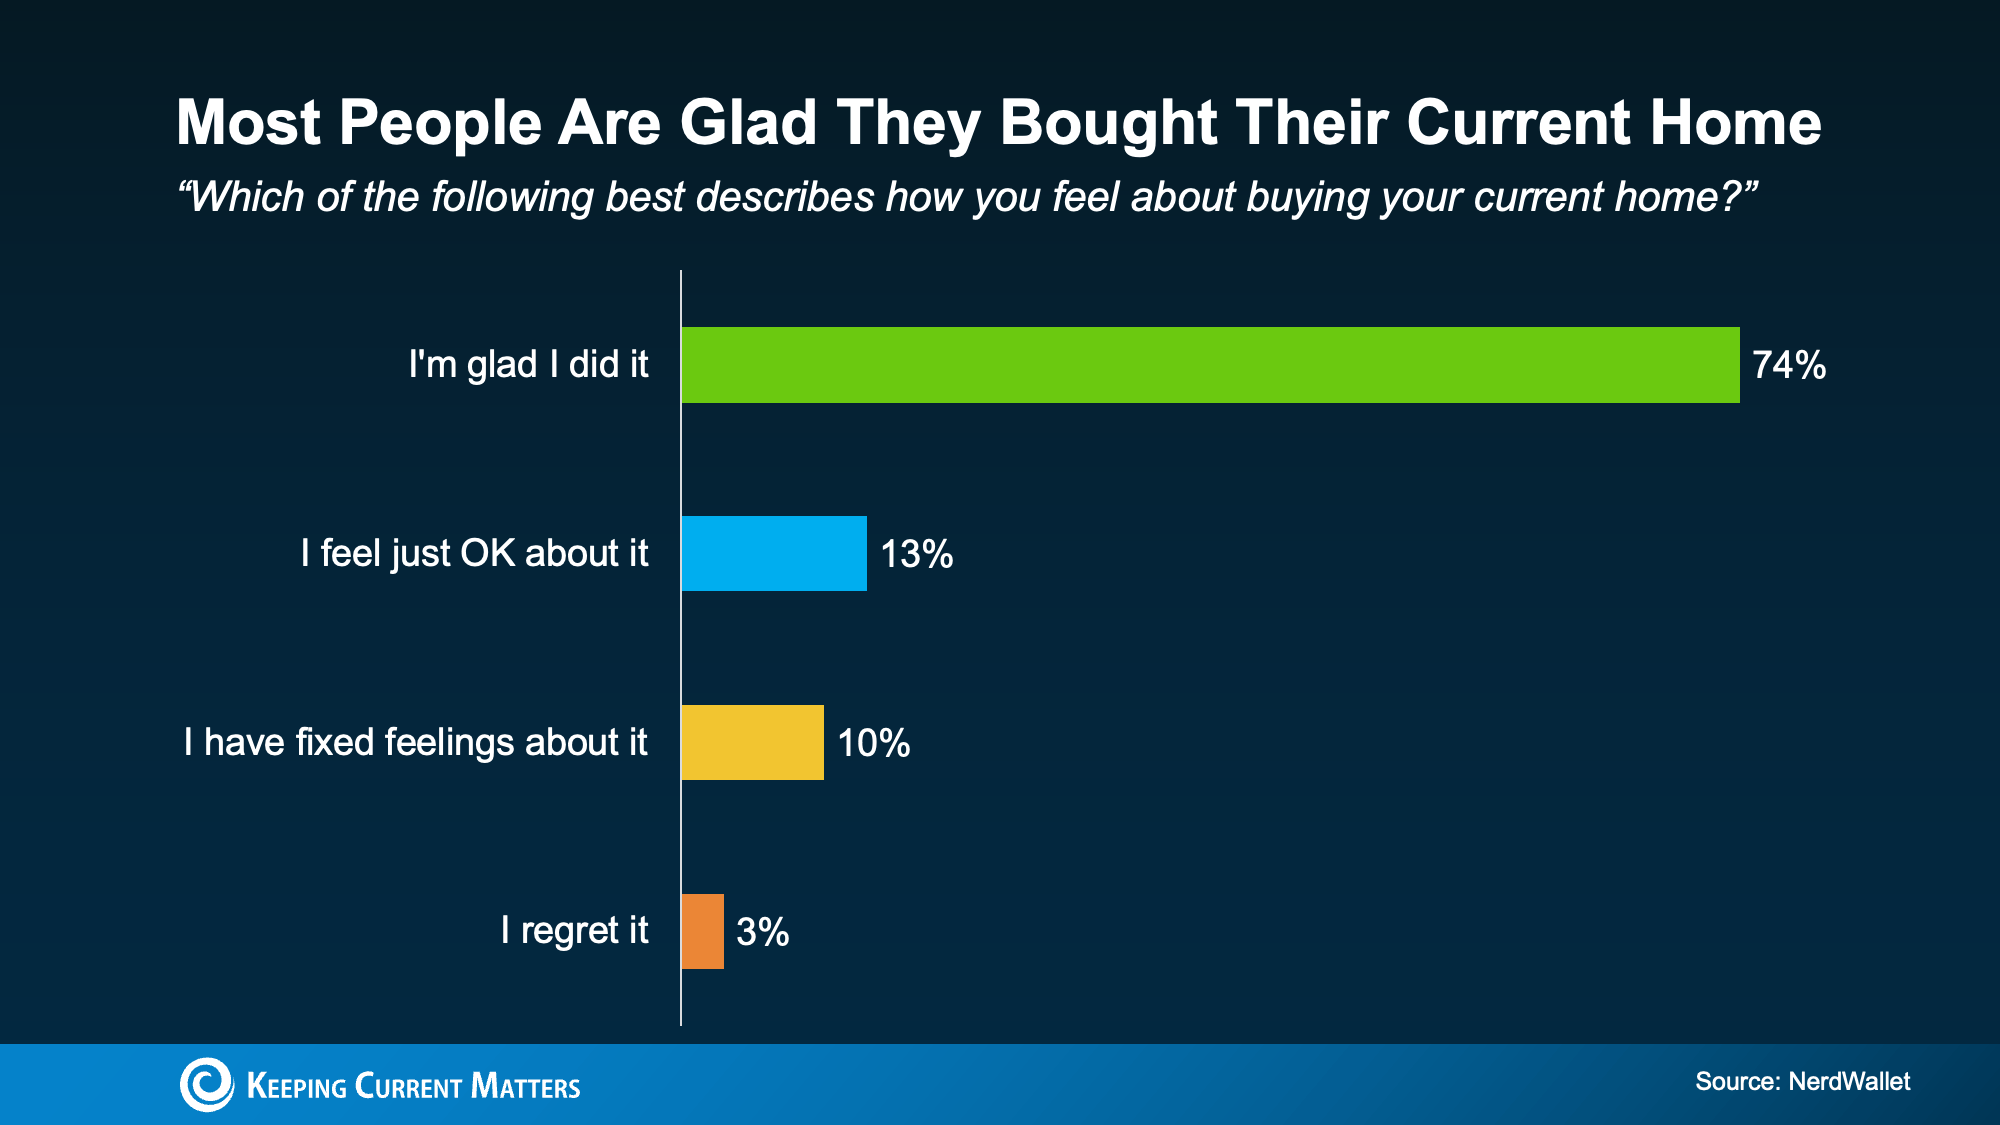
Most recent buyers are glad they bought, and only a small share regret it. Source: NerdWallet via Keeping Current Matters.
A recent survey from NerdWallet says most buyers do not. About 74% of recent buyers said they are glad they bought their current home, and only 3% said they regret it.
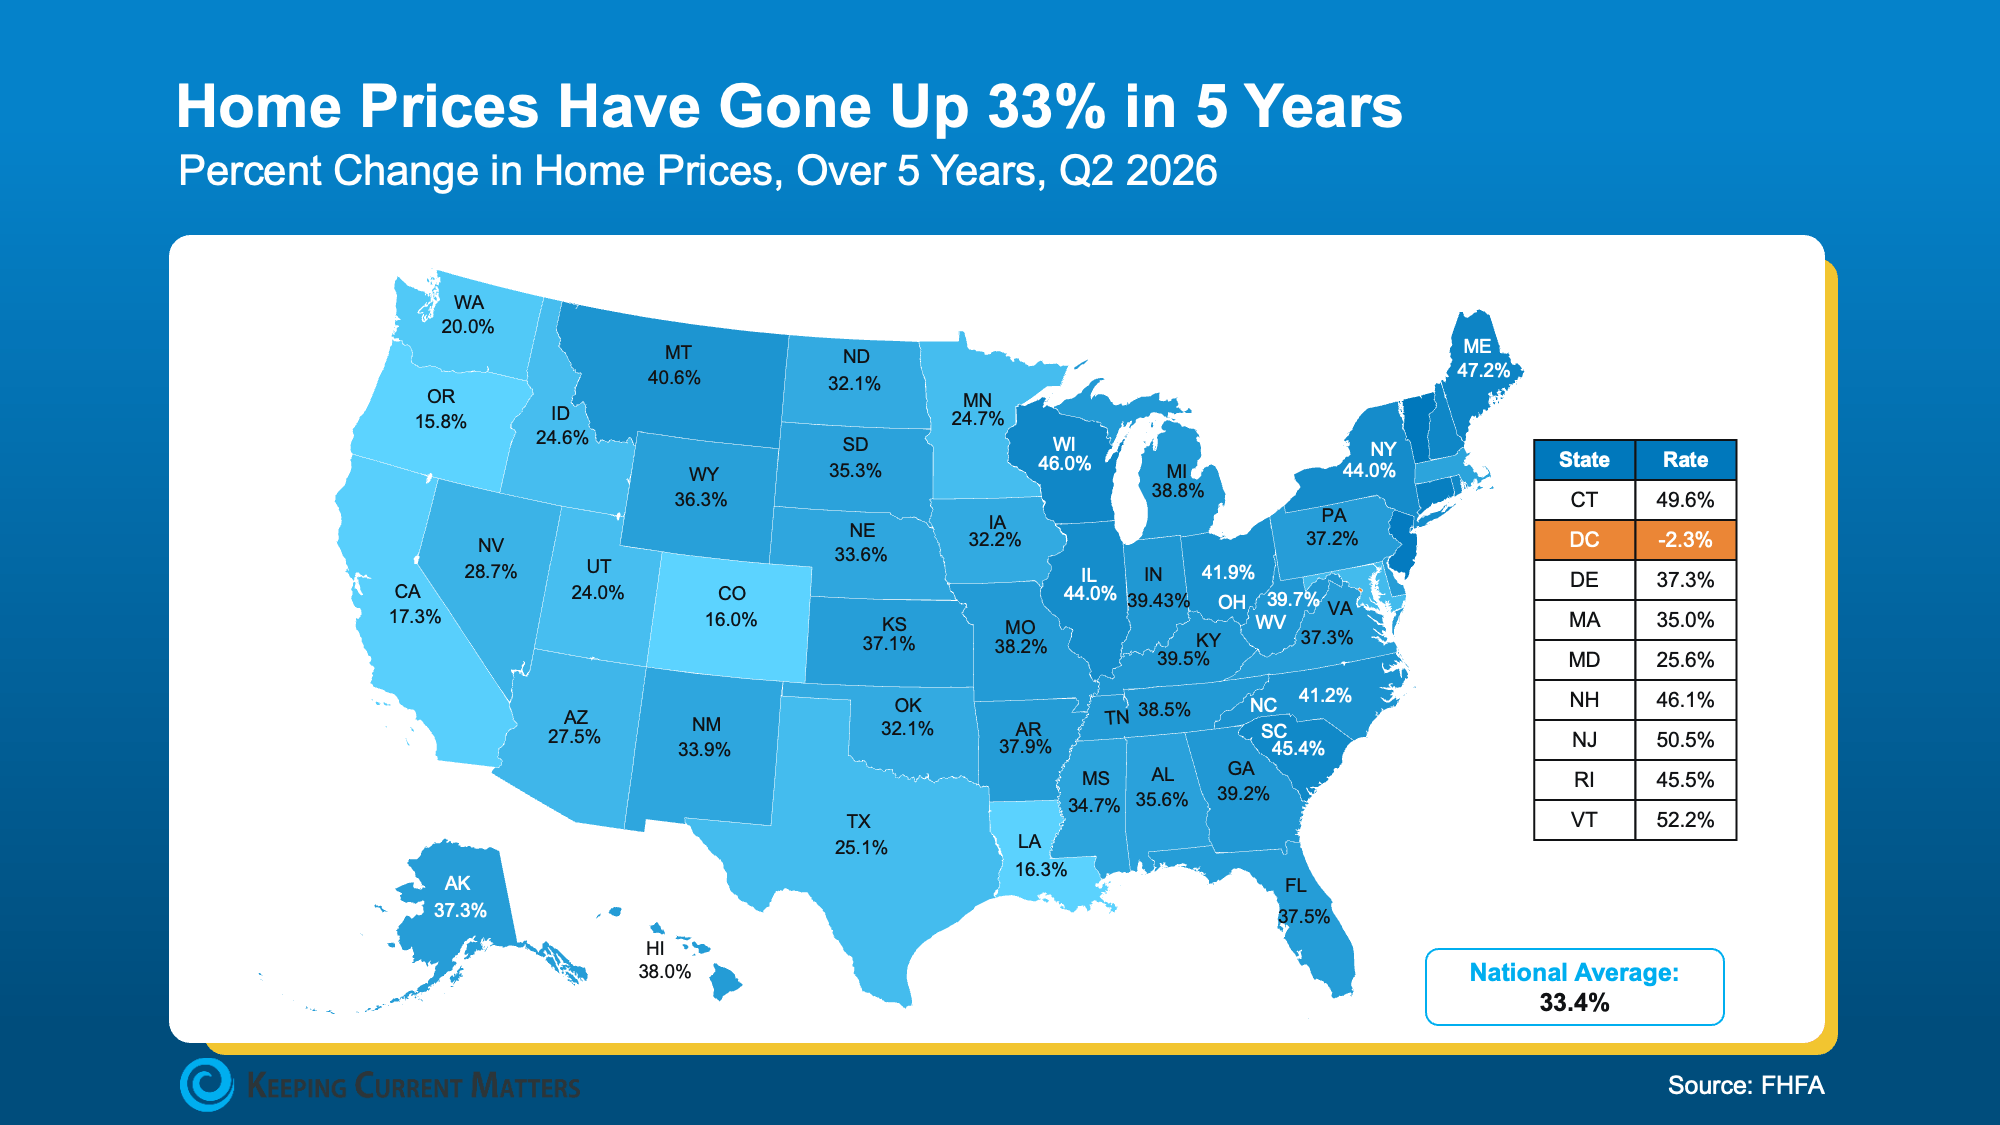
A big reason is time. A home is not usually a one or two year decision. Data from the Federal Housing Finance Agency shows home prices nationally are up 33.4% over the past five years. Research from Bankrate found homeowners gained nearly $150,000 in wealth on average over that same stretch, as equity rose in 90% of major metro areas.
Home prices nationally have risen 33.4% over the past five years. Source: Federal Housing Finance Agency via Keeping Current Matters.
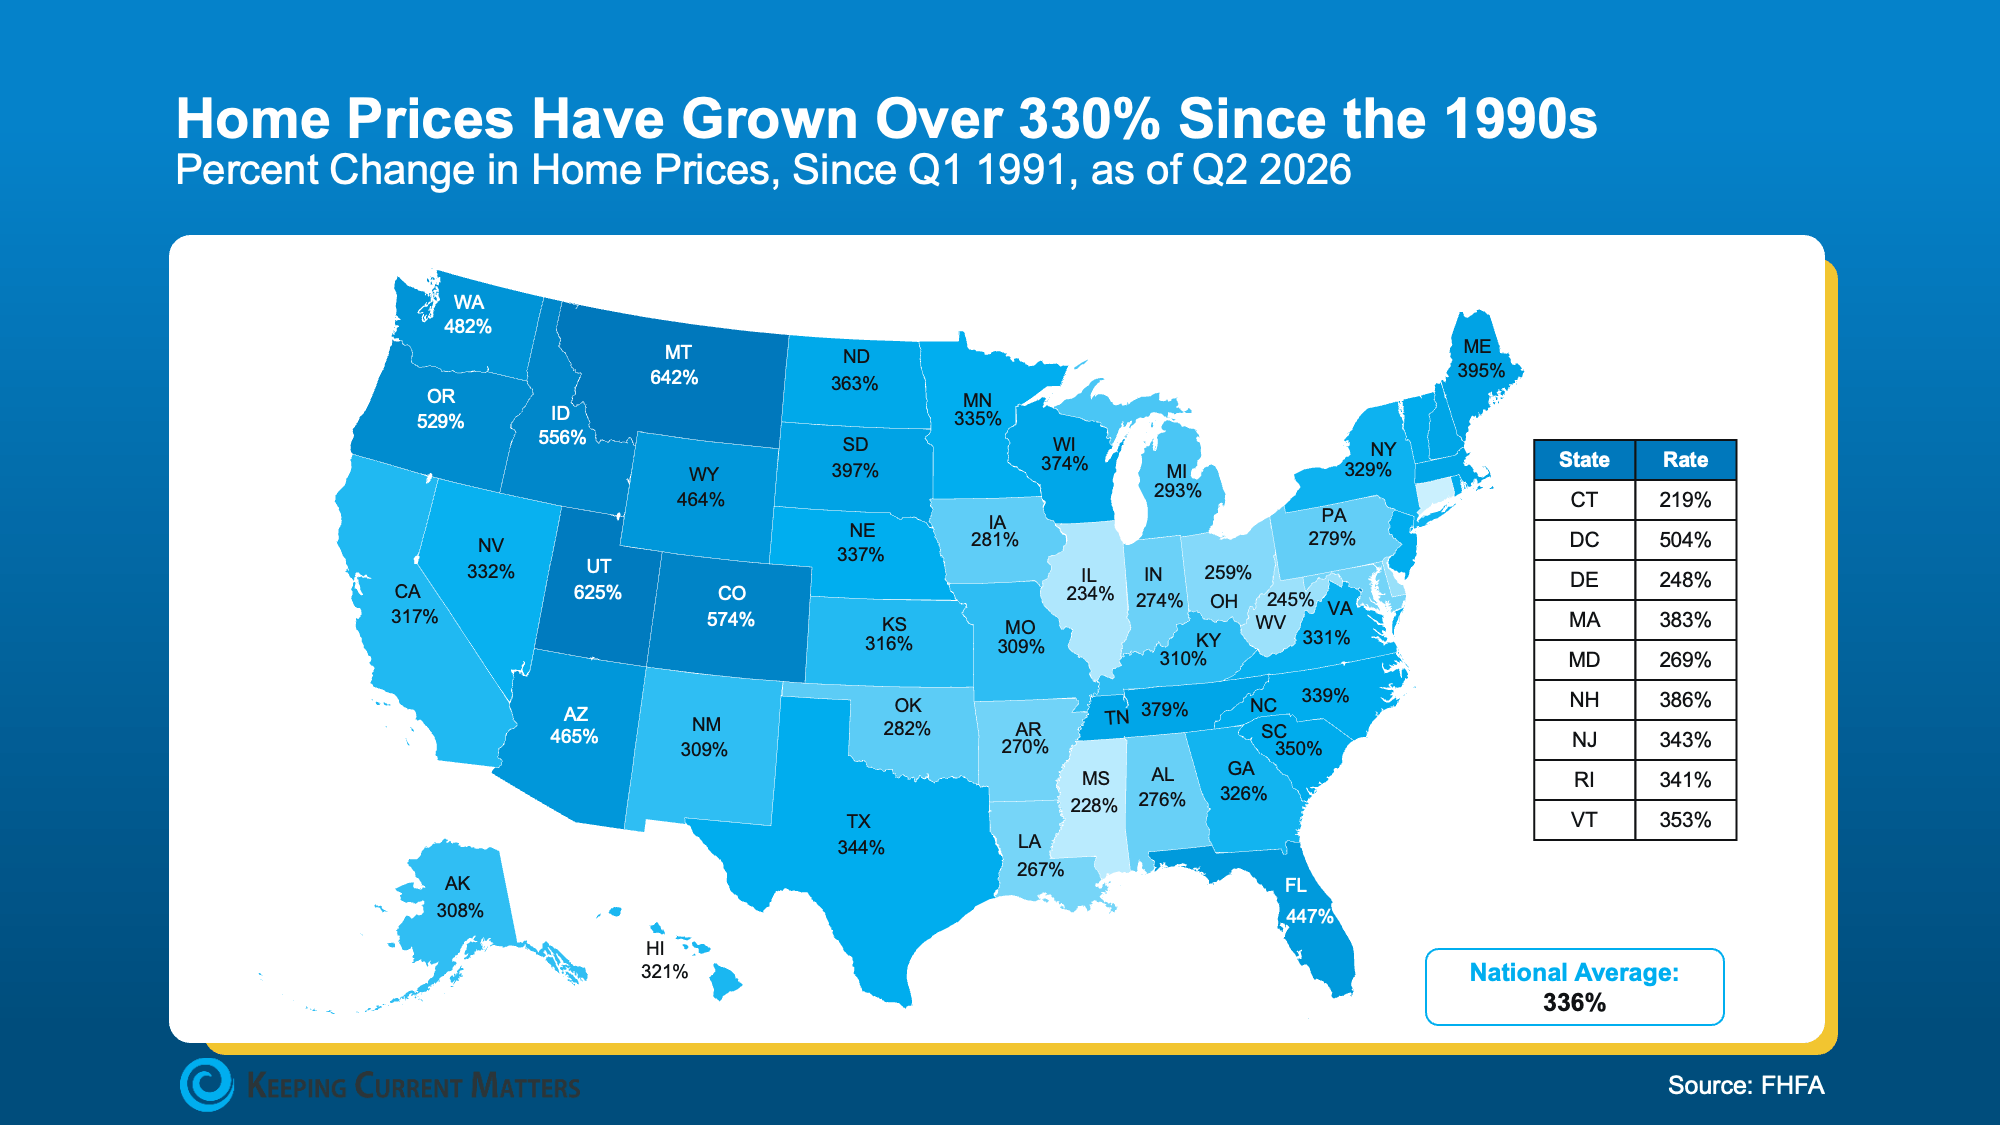
Zoom out further and the picture gets clearer. Prices are up 336% since 1991, according to that same FHFA data. That does not mean prices rise every year, and it does not mean you should buy if the payment does not work for you. It does mean trying to time the perfect moment can cause you to miss the long term gain.
Home prices nationally have risen 336% since 1991. Source: Federal Housing Finance Agency via Keeping Current Matters.
If the numbers work for you today, buying now could set you up for your next move down the road. Let’s look at your numbers together and talk through what owning could mean for you in the years ahead.
Market insights by Keeping Current Matters. Shared by Jarvid Cortes, Your Favorite Bilingual Realtor.
Why There Are More Homes for Sale Right Now (and What It Means for You)
Mortgage rates being back above 7% isn’t exactly the news most people wanted. But it’s changing the market in ways that matter whether you’re buying or selling.
The number of homes for sale is growing faster than it was this time last year. And interestingly, the main reason isn’t a flood of new listings. It’s because homes aren’t selling as quickly.
Here’s why and what that means if you’re thinking about buying or selling.
Inventory Growth Is Picking Up Steam
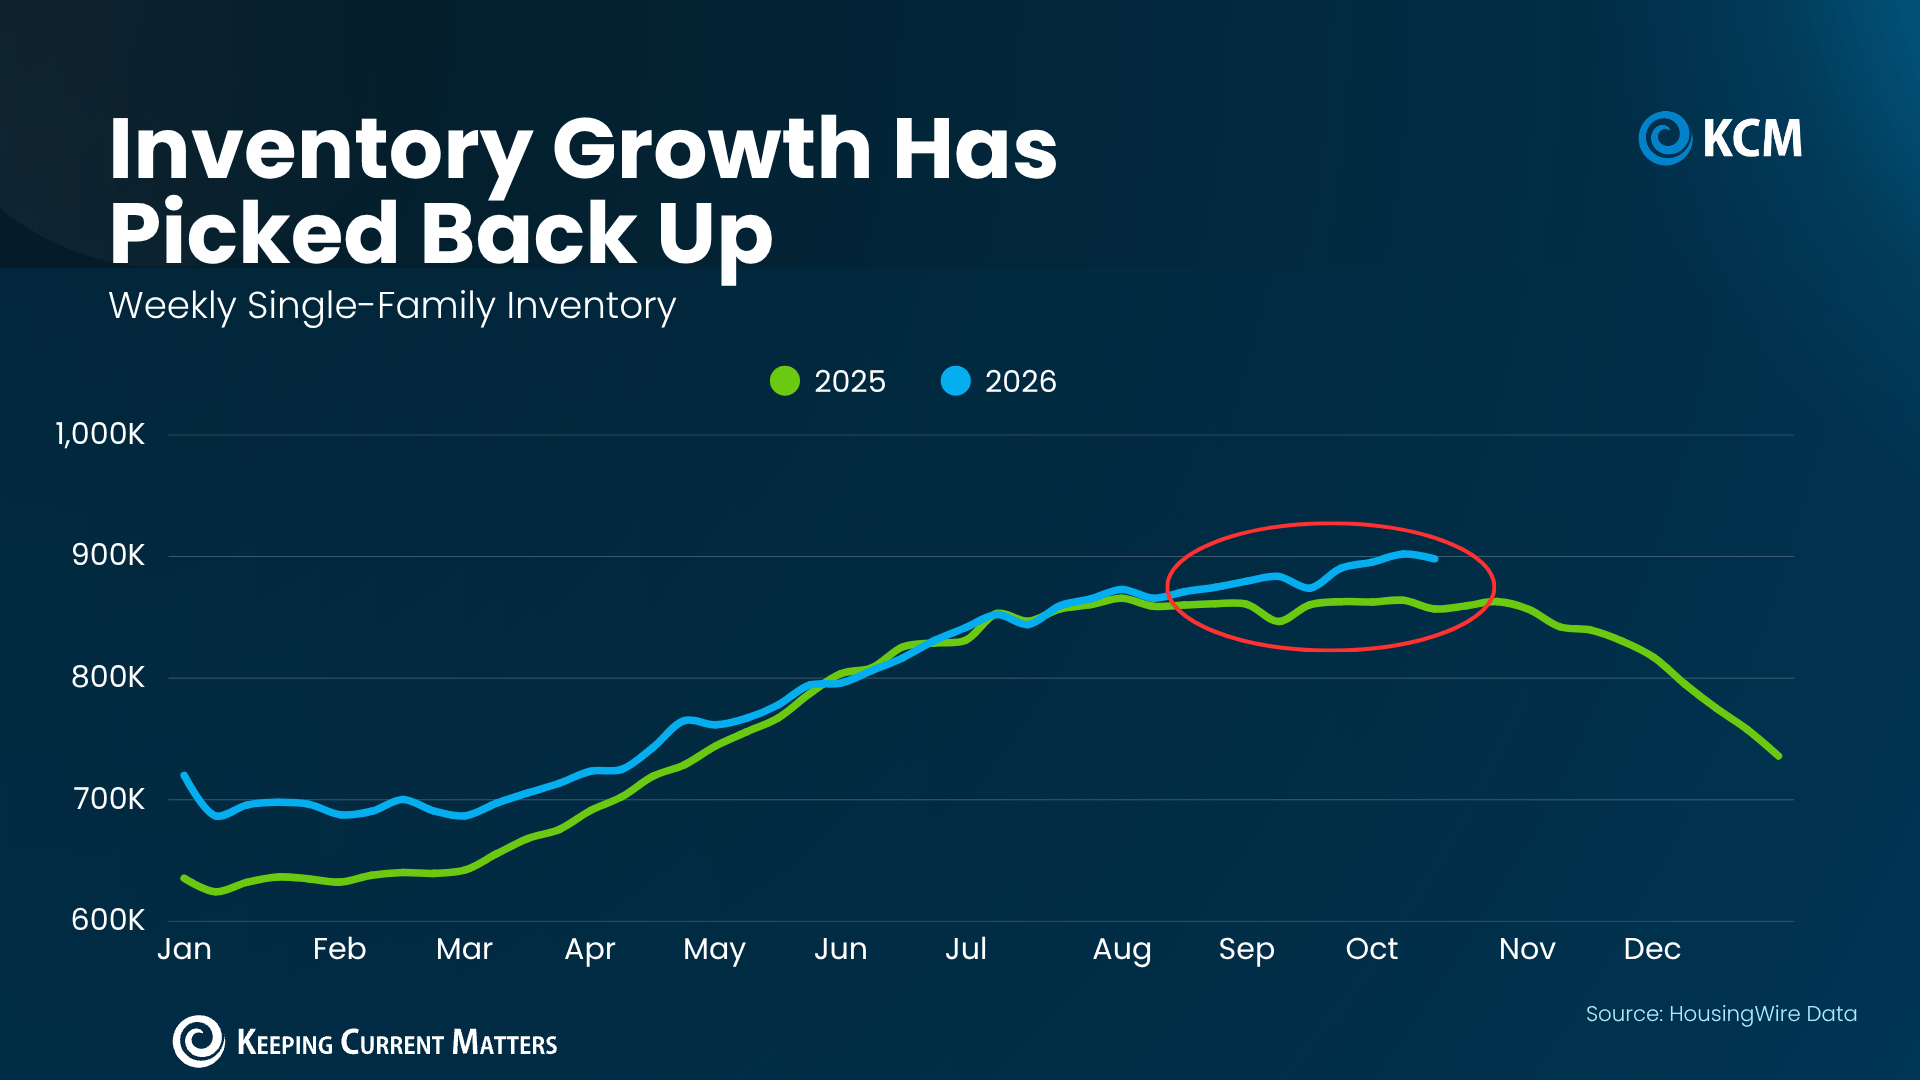
According to HousingWire Data, after inventory growth slowed down for most of the past year, it’s accelerated again in recent weeks. You can see that in the graph below. Just look at the blue line:
Inventory growth is picking up steam again. Source: HousingWire Data via Keeping Current Matters.
And what’s behind this shift might surprise you.
When rates rise, some buyers hit pause. That means fewer homes sell each week. And as those unsold homes stay on the market alongside new listings, the number available starts to grow (see the blue line in the graph below).
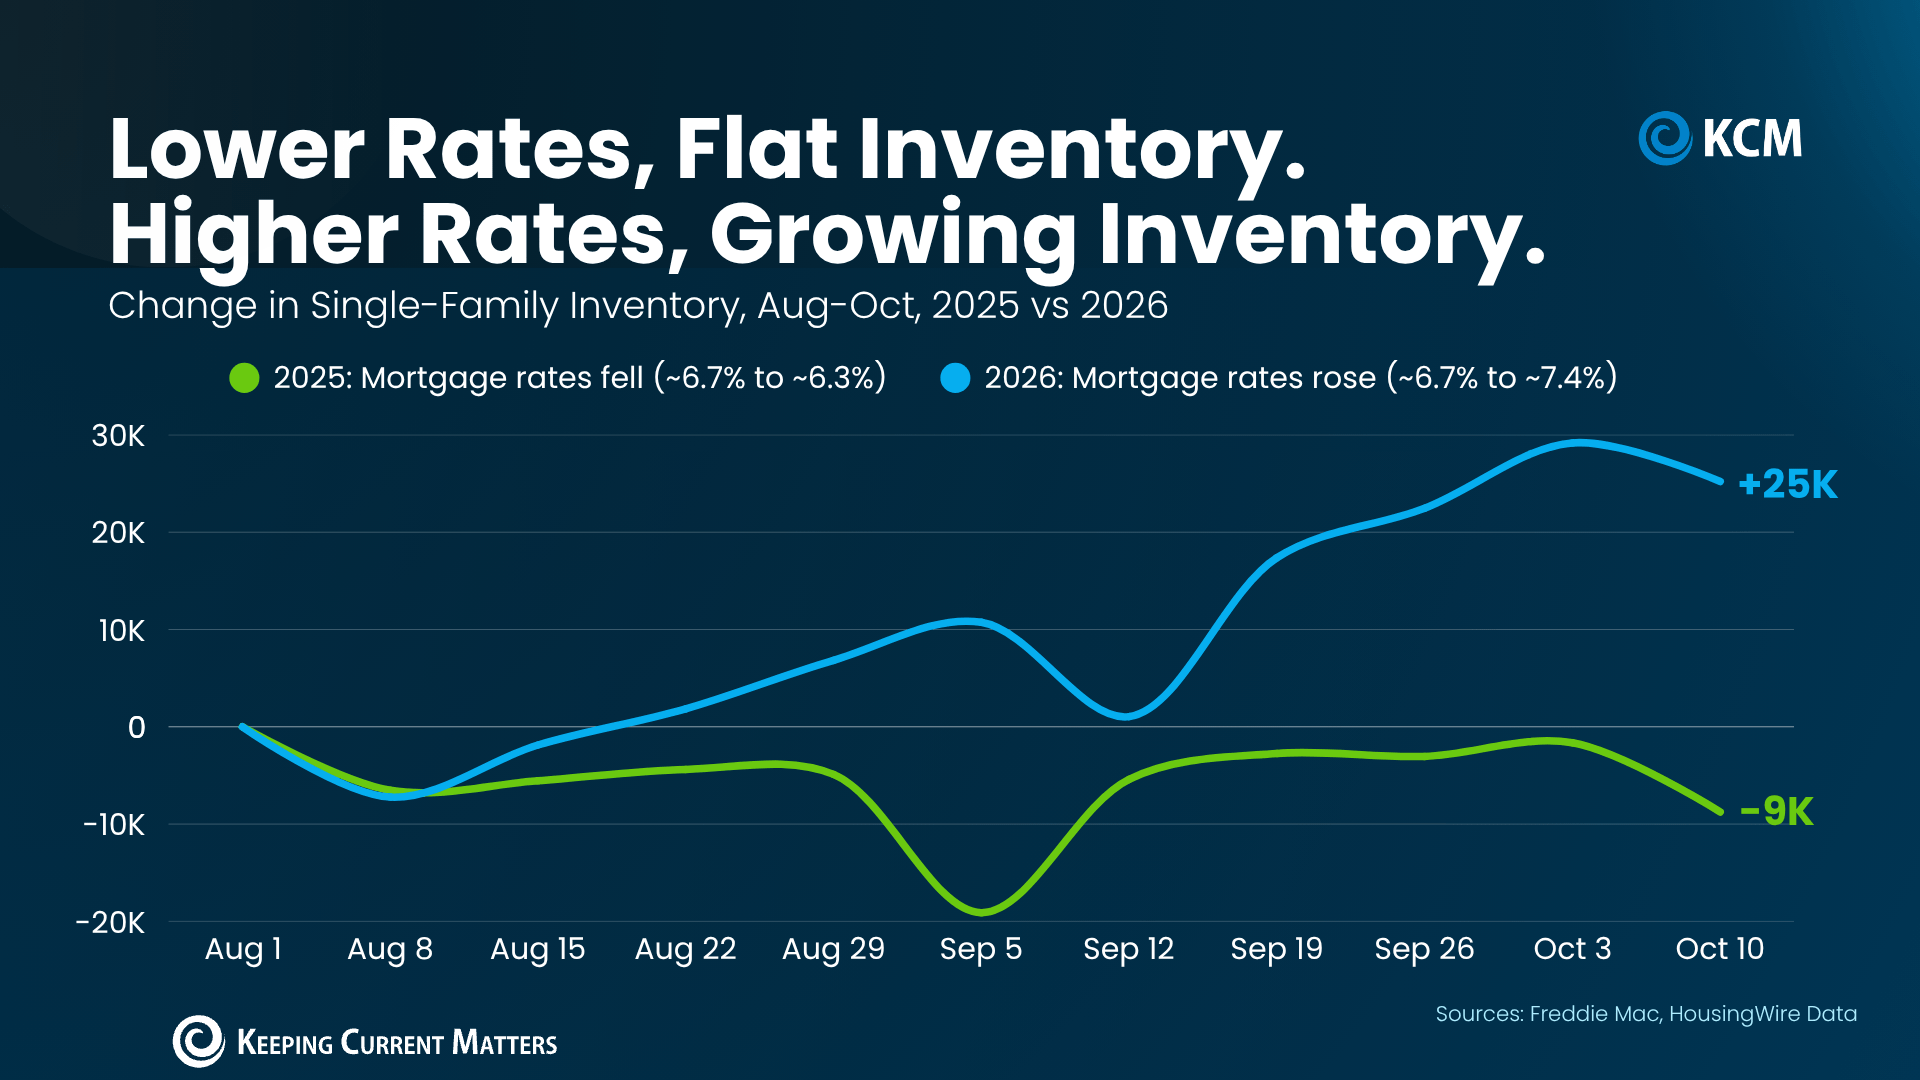
Here’s another way to look at it to make it even more obvious. The graph below shows the relationship between rates and inventory. Again, this year is the blue line. Last year? That’s the green.
With rates inching up this year, you can see inventory has grown by about 25k. But when rates went down this time last year, buyers jumped back in, and inventory actually dropped by about 9k.
When rates rise, inventory grows. When rates fall, buyers jump back in. Source: HousingWire Data via Keeping Current Matters.
Logan Mohtashami, Lead Analyst at HousingWire, explains how that’s flipped from 2025 to 2026:
“With mortgage rates over 7%, demand tends to soften and inventory rises . . .”
Homes Are Spending More Time on the Market
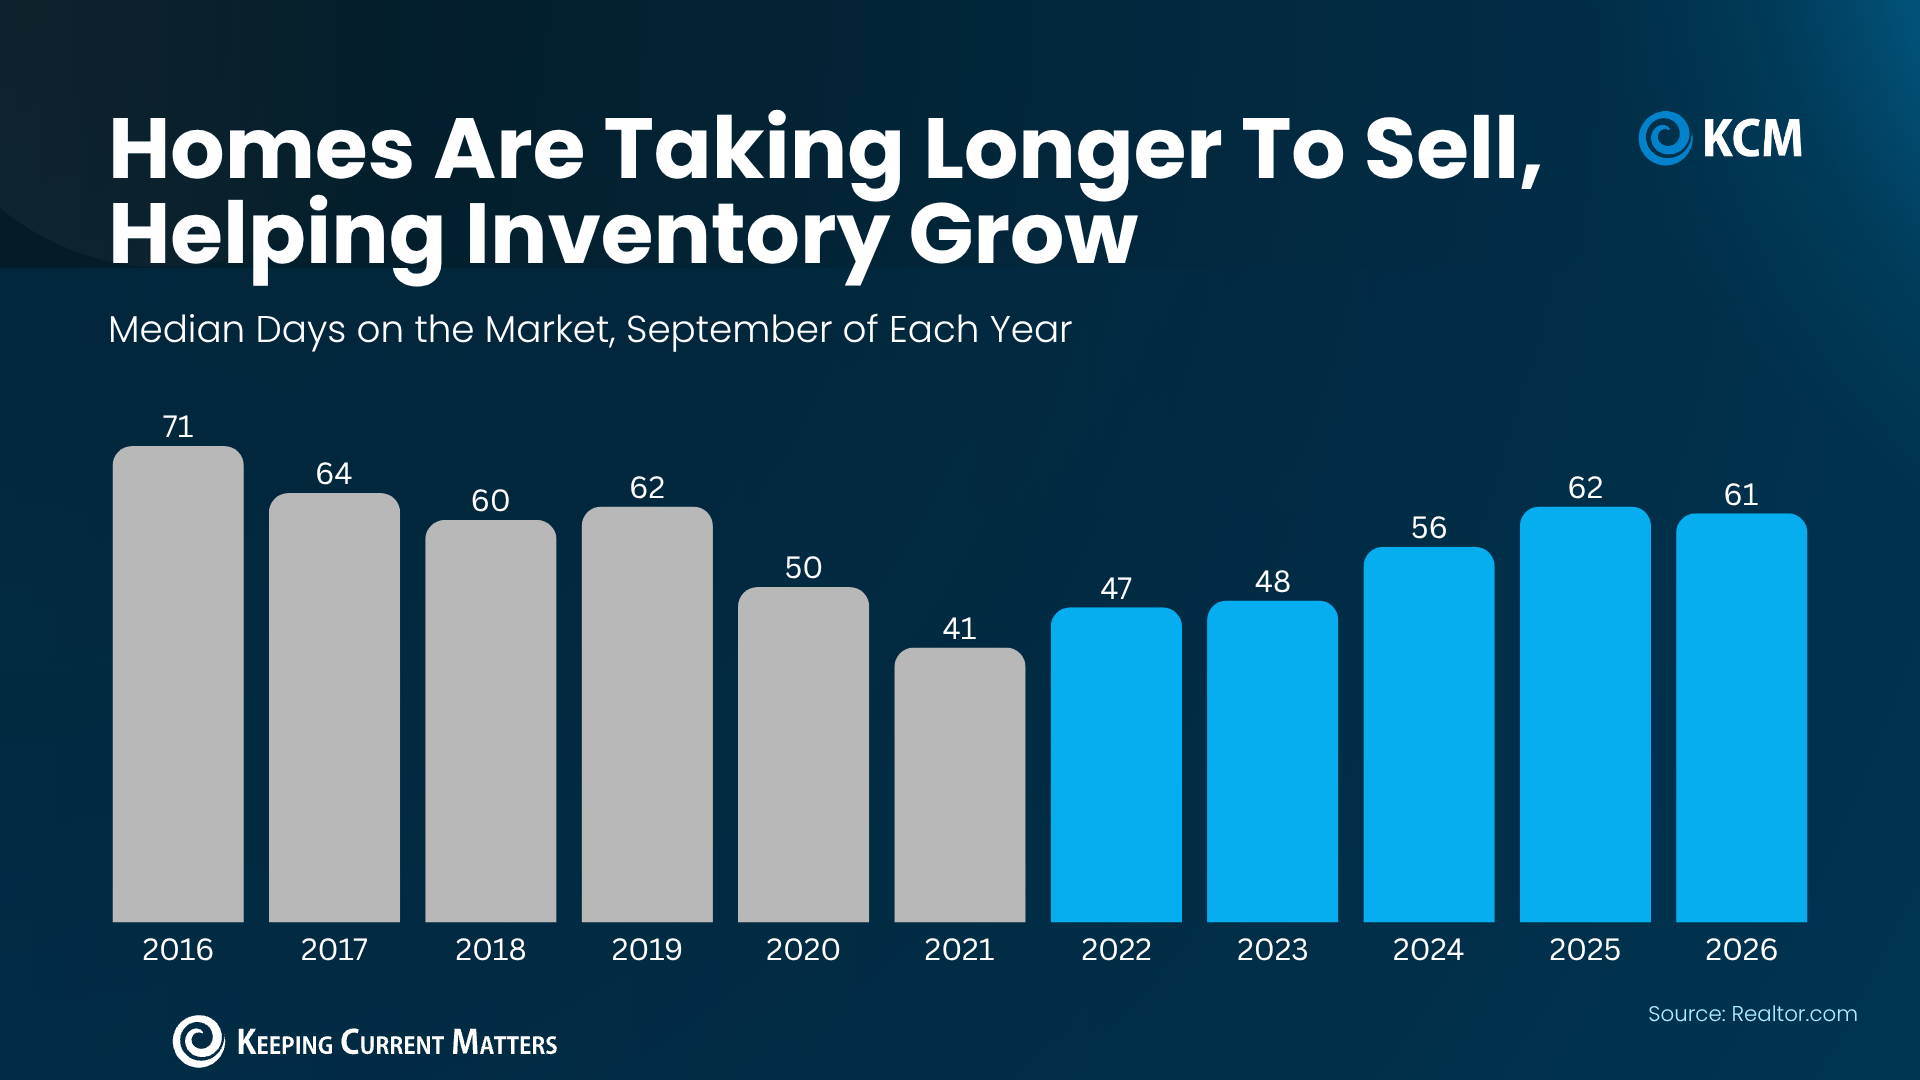
Here’s another metric that shows the impact rates are having: time on market. Data from Realtor.com shows the typical home spent 61 days on the market this September. Back in September 2021, it was just 41 days (see graph below):
The typical home spent 61 days on the market this September, up from 41 in September 2021. Source: Realtor.com via Keeping Current Matters.
Here’s what that tells us. In 2021, when rates were low, more buyers were active, and homes sold fast. But now that rates are a bit higher, not as many buyers are interested, so it takes a bit longer to close a deal.
How To Make This Market Work for You
So, what does all of this mean for your plans? That depends on which side of the move you’re on:
If you’re buying, more homes for sale means more choices and less pressure to rush. And more room to negotiate too. A house that’s been sitting for a while could have a seller who’s more willing to talk – not just about price, but repairs, closing costs, or even helping buy down your mortgage rate.
That doesn’t mean every seller will play ball. But compared to the frenzy of a few years ago, buyers have more leverage now.
If you’re selling, the right strategy can make all the difference. Buyers have more homes to choose from, so making yours stand out is especially important. That starts with pricing it right from day one, making a great first impression, and working with your agent to highlight what makes your house worth choosing. Buyers are still buying and homes are still selling. The key is making sure yours is positioned to attract the right buyer.
The market hasn’t stopped. It’s just moving at a different pace. And whether you’re buying or selling, your strategy needs to move with it.
Bottom Line
In many places right now, inventory is growing and homes are taking a bit longer to sell. And that’s information that should shape the strategy you use going in.
Whether you’re buying or selling, connect with a local real estate agent to look at how long homes are taking to sell in your neighborhood, so your offer, or your price, fits today’s market.
Market insights by Keeping Current Matters. Shared by Jarvid Cortes, Your Favorite Bilingual Realtor.
Gloucester & the North Shore: coastal demand holds
Waterfront and water-view properties continue to command premiums, while well-priced in-town homes move quickly. For current Gloucester figures on median sale price, days on market, and inventory, talk with Jarvid.
What it means: Pricing and timing still reward preparation. A conversation with Jarvid will ground your next move in current data.
September 2026
Boston Metro: condos, multifamily and the investor picture
Boston Metro condo and multifamily pricing moves quickly, and investor demand for multifamily stays active. For current figures, reach out to Jarvid.
What it means: Investors who know their numbers move first. Jarvid can walk you through what the current data means for your strategy.
September 2026
Luxury: the $1M+ market on the North Shore
Documented Jarvid transactions in this tier include 23 Way Road, Gloucester ($2.775M seller representation). For the latest $1M+ activity, ask Jarvid.
What it means: Well-positioned North Shore properties continue to draw strong interest. For current luxury figures, contact Jarvid.
Data note: Market figures on this page update with live MLS data. Figures are never estimated or carried over from third-party portals.
Want the numbers for your street?
Jarvid will run the comparables that actually matter for your decision.